Short answer
To make a boring log, add a project and a borehole in GeoEQ SPT Logs, enter the SPT blows, strata and header facts, and check the sheet that redraws beside the tables. N is computed from the 2nd and 3rd 15 cm blow counts.
Steps
- 01
Open the demo project to see a finished boring log
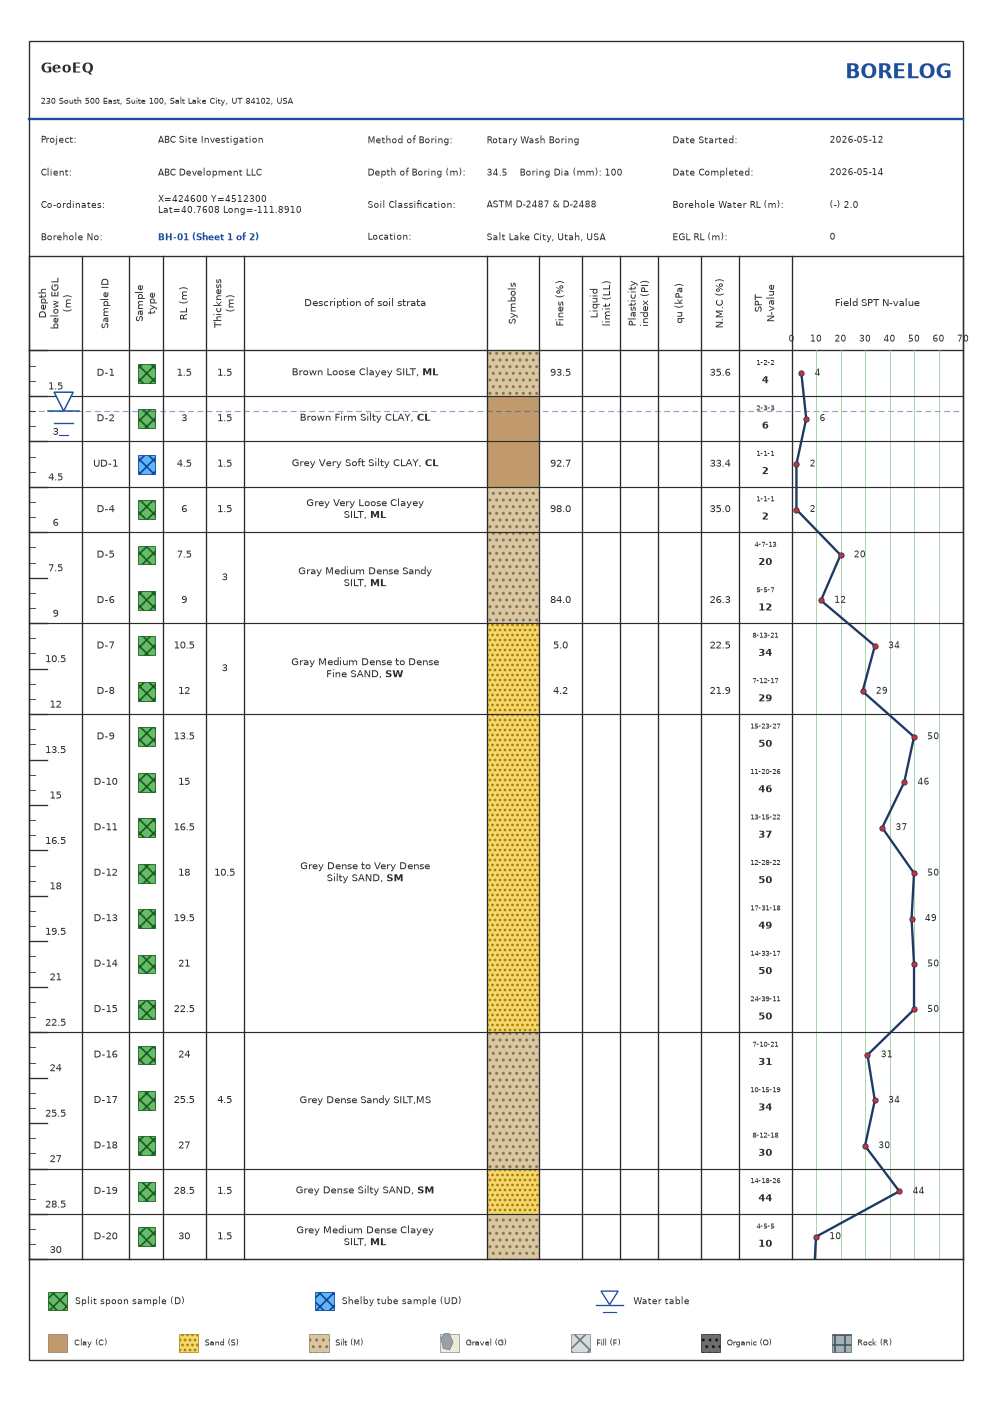
Choose File, then Open demo project. It is a complete borelog imported from a real field workbook, so you can compare your own sheet against it.
- 02
Add a project
Right-click empty space in the project explorer and choose Add project. Double-click the project (or right-click and choose Project settings) and enter the project name, client and location. These are pulled into every borehole header in that project.
- 03
Set the units and test interval
In Project settings choose Metric (m, kPa, mm) or Imperial (ft, tsf, in). Units change labels only; values are never converted, so type numbers in the unit the project uses. Set the test interval and first depth if yours differ from the default of 1.5 m.
- 04
Add a borehole and open it
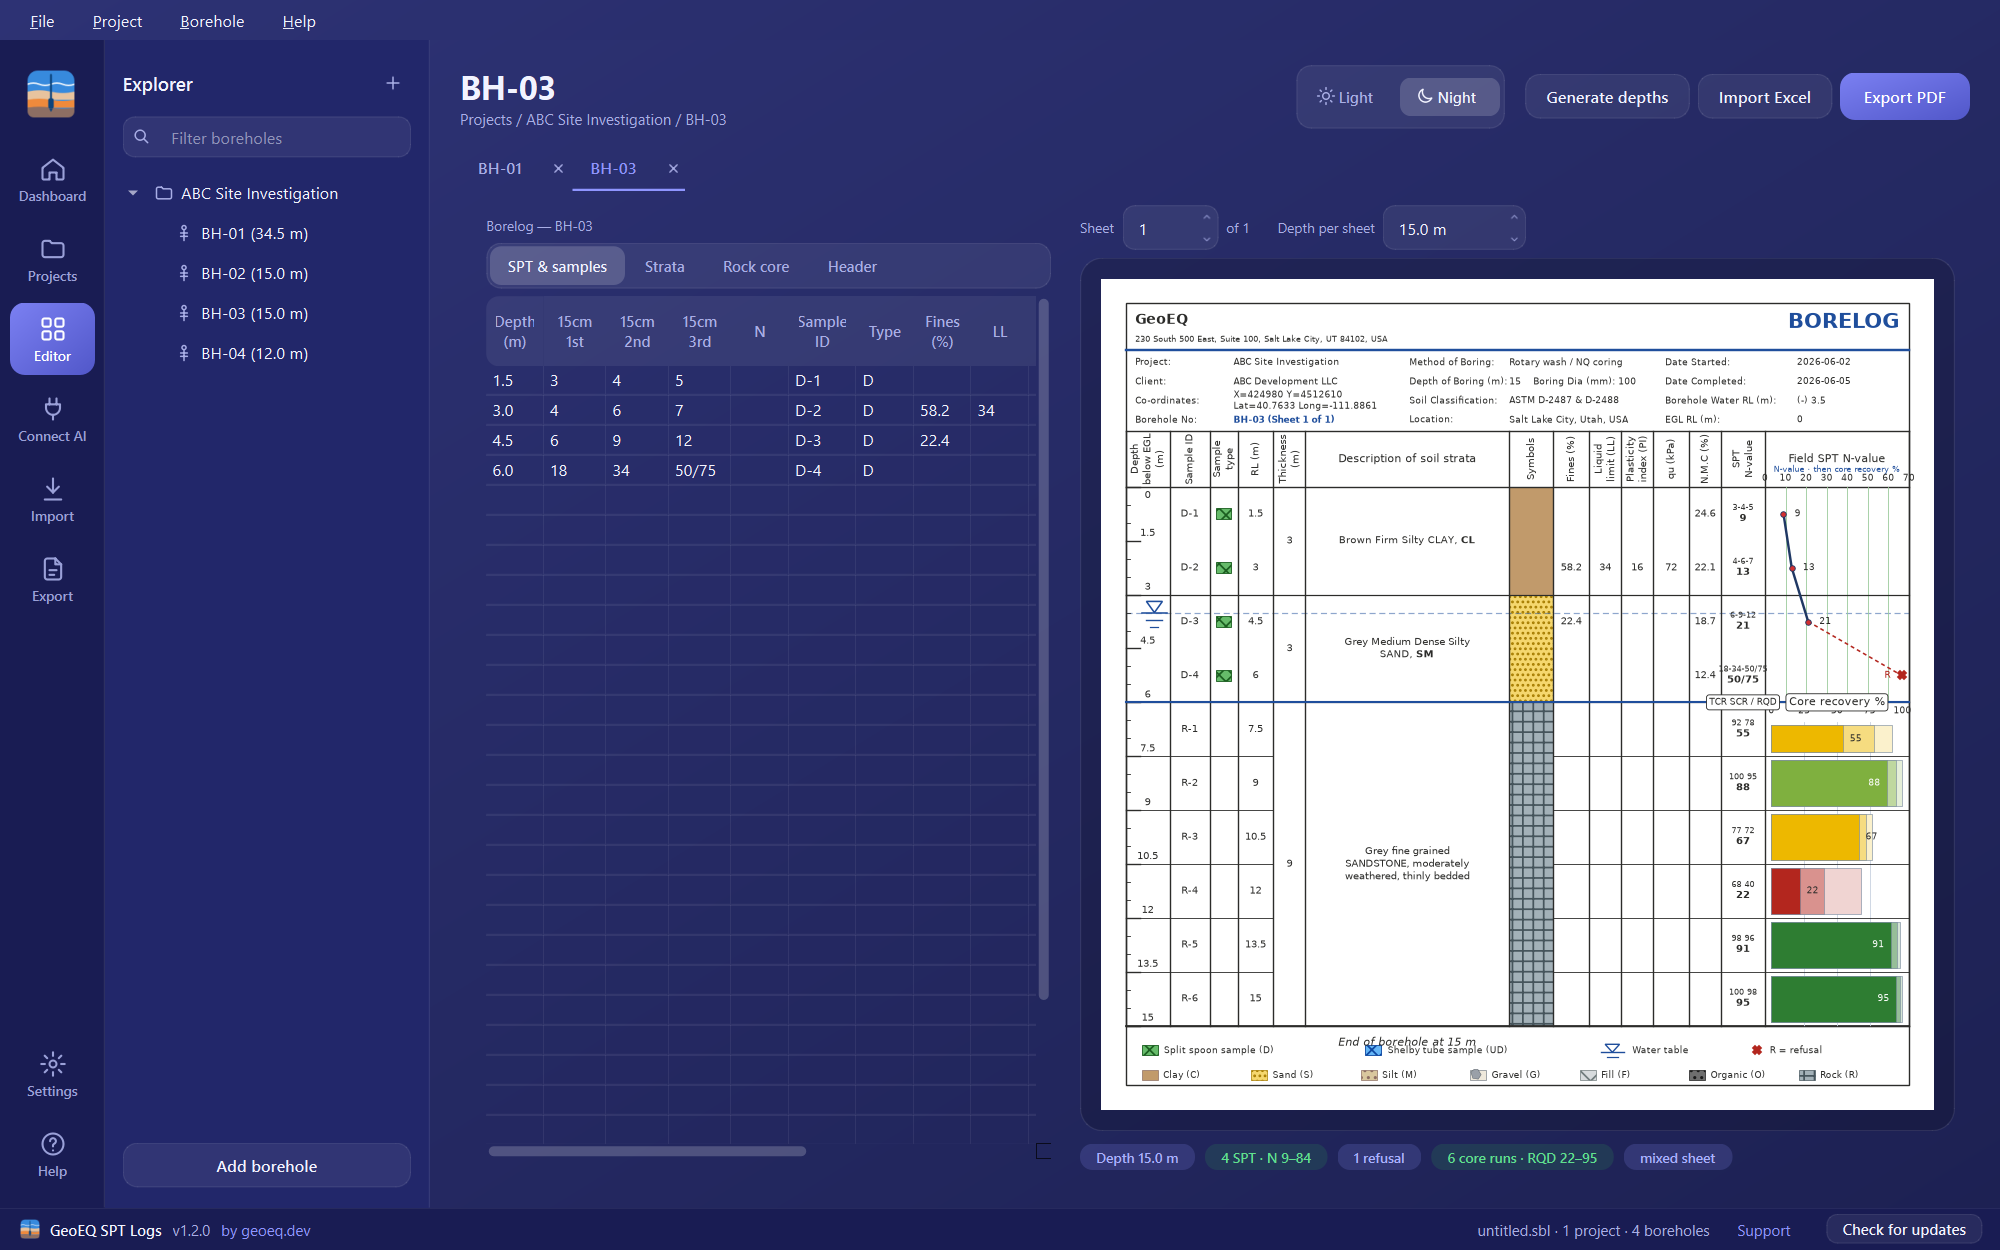
Right-click the project, choose Add borehole, then double-click the new borehole to open its borelog. Four input tabs appear: SPT & samples, Strata, Rock core and Header.
- 05
Enter the SPT data
On the SPT & samples tab, add one row per test: depth, the three 15 cm blow counts, sample ID and type (D for split spoon, UD for Shelby tube), and any lab results. N is computed as the 2nd plus 3rd count, or you can type N directly if blow counts are unknown. Generate depths fills the depth column at your test interval, and the tables accept Excel-style copy and paste.
- 06
Enter the strata
On the Strata tab, give the bottom depth, description and soil type letter for each layer. The letter is guessed from the description, so Sandy SILT becomes M, and it sets the coloured symbol column. A USCS symbol at the end of a description, such as SILT,ML, is printed in bold.
- 07
Fill in the Header tab
Enter coordinates, dates, boring method, water RL, boring diameter, classification standard and EGL reduced level. A water RL of (-) 5.0 places the water marker at 5.0 m.
- 08
Check the sheet and save the project
The sheet on the right redraws with every edit; use the Sheet spinner for multi-page logs. Then save the project as a .sbl file.
Before you start
A boring log is built from three kinds of input: the SPT and sample record (depths, blow counts, sample IDs), the strata (what the driller or logger saw between depths) and the header (who, where, when, how). Have them to hand in whatever form they exist, whether field sheets or a workbook. If the data is already in Excel, the import tutorial is faster than typing.
Each project file (.sbl) can hold several projects, and each project holds boreholes. Shared information such as client and location is entered once at project level.
Common problems
The water marker did not move. The marker follows the number in the Water RL header field. Enter (-) 5.0 to place it 5.0 m below ground level.
Refusal. Type the driller’s notation into the increment cell, for example 50/75 for 50 blows for 75 mm. The sheet prints it as written and breaks the N-value graph to a refusal marker instead of plotting a point as if the test had finished.
A D and a UD sample at the same depth. The sheet shows one merged row, using the UD identity with the SPT blows and combined lab values.
What to do next
Give your sheets the office look with the company header tutorial, then export the finished boreholes to PDF. If you drilled into rock, continue with the rock core tutorial.
Frequently asked questions
Is a boring log the same as a borehole log?
In practice yes. Boring log is the usual term in the United States and borehole log in the UK and internationally. GeoEQ SPT Logs lets you choose the sheet title, including BORING LOG, BOREHOLE LOG, BORE LOG and LOG OF BORING, and the body of the sheet follows your choice.
What goes on a boring log?
A GeoEQ SPT Logs sheet carries a header (project, client, location, coordinates, method, dates, water level), the depth scale, sample IDs and types, strata descriptions with soil symbols, laboratory values, SPT blow counts and N, and a graph of N against depth.
How is the SPT N-value calculated in the app?
N is the sum of the 2nd and 3rd 15 cm blow counts. If you only have a recorded N, type it into the N column and it is used directly.
Do I need a template?
No. The sheet layout is built in and is drawn live from the data you enter, so there is no spreadsheet template to maintain.